
NCERT Solutions Class 9 Maths
Chapter – 14 (Statistics)
The NCERT Solutions in English Language for Class 9 Mathematics Chapter – 14 Statistics Exercise 14.3 has been provided here to help the students in solving the questions from this exercise.
Chapter 14: Statistics
- NCERT Solution Class 9 Maths Ex – 14.1
- NCERT Solution Class 9 Maths Ex – 14.2
- NCERT Solution Class 9 Maths Ex – 14.4
Exercise – 14.3
1. A survey conducted by an organisation for the cause of illness and death among women between the ages 15 – 44 (in years) worldwide found the following figures (in %):
| S.No. | Causes | Female fatality rate (%) |
| 1. | Reproductive health conditions | 31.8 |
| 2. | Neuropsychiatric conditions | 25.4 |
| 3. | Injuries | 12.4 |
| 4. | Cardiovascular conditions | 4.3 |
| 5. | Respiratory conditions | 4.1 |
| 6. | Other causes | 22.0 |
(i) Represent the information given above graphically.
(ii) Which condition is the major cause of women’s ill health and death worldwide?
(iii) Try to find out, with the help of your teacher, any two factors which play a major role in the cause in (ii) above is the major cause.
Answer – The given data can be represented by using a bar graph as shown below:
(i) The information given in the question is represented below graphically.
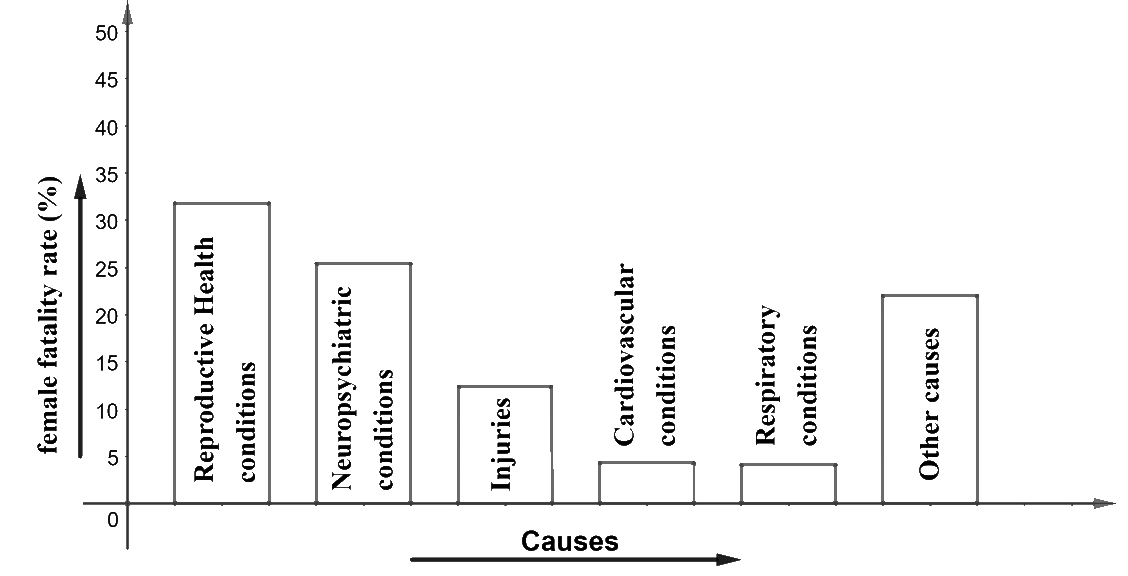
(ii) We can observe from the graph that reproductive health conditions are the major cause of women’s ill health and death worldwide.
(iii) Two factors responsible for the cause in (ii) are:
- Lack of proper care and understanding.
- Lack of medical facilities.
2. The following data on the number of girls (to the nearest ten) per thousand boys in different sections of Indian society are given below.
| S.No. | Section | Number of girls per thousand boys |
| 1. | Scheduled Caste (SC) | 940 |
| 2. | Scheduled Tribe (ST) | 970 |
| 3. | Non SC/ST | 920 |
| 4. | Backward districts | 950 |
| 5. | Non-backward districts | 920 |
| 6. | Rural | 930 |
| 7. | Urban | 910 |
(i) Represent the information above by a bar graph.
(ii) In the classroom, discuss what conclusions can be arrived at from the graph.
Answer –
(i) The above data can be represented on a bar graph as below:
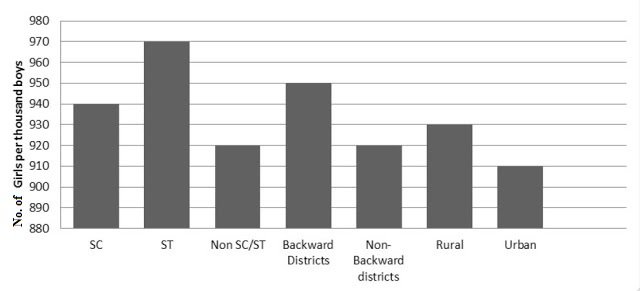
(ii) It can be observed from the graph that:
- The number of girls per thousand boys represented in the graph is maximum for Scheduled Tribe (ST).
- The number of girls per thousand boys represented in the graph is lowest for urban.
- The number of girls per thousand boys are higher in rural area than in urban.
- The number of girls per thousand boys are also higher in backward districts than in non-backwards.
3. Given below are the seats won by different political parties in the polling outcome of a state assembly election:
| Political party | A | B | C | D | E | F |
| Seats won | 75 | 55 | 37 | 29 | 10 | 37 |
(i) Draw a bar graph to represent the polling results.
(ii) Which political party won the maximum number of seats?
Answer –
(i) The given data is represented on a bar graph by:
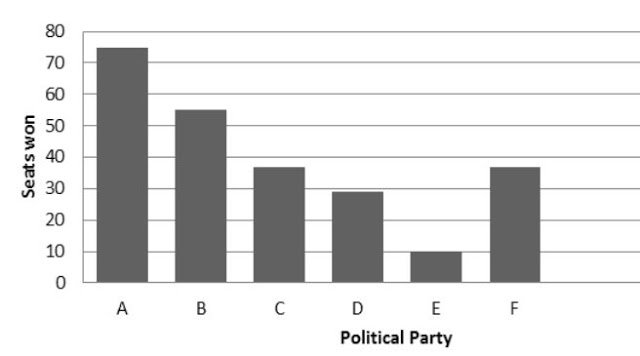
(ii) From the graph, it can be observed that the political party ‘A’ won the maximum number of results.
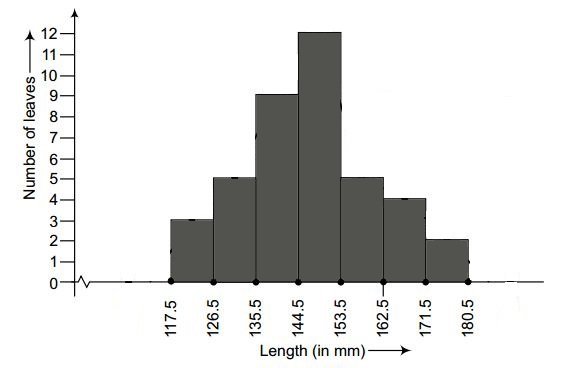
4. The length of 40 leaves of a plant is measured correct to one millimeter, and the obtained data is represented in the following table:
| S.No. | Length (in mm) | Number of leaves |
| 1. | 118 – 126 | 3 |
| 2. | 127 – 135 | 5 |
| 3. | 136 – 144 | 9 |
| 4. | 145 – 153 | 12 |
| 5. | 154 – 162 | 5 |
| 6. | 163 – 171 | 4 |
| 7. | 172 – 180 | 2 |
(i) Draw a histogram to represent the given data. [Hint: First make the class intervals continuous]
(ii) Is there any other suitable graphical representation for the same data?
(iii) Is it correct to conclude that the maximum number of leaves is 153 mm long? Why?
Answer –
(i) We have to find the difference between the upper limit and the lower limit of a class. We then add half of the resultant difference to each upper limits and subtract the same resultant difference from each of the lower limits. Since the difference between the upper limit and the lower limit of a class is 1 i.e, (127 – 126 = 1). So half of 1 is 0.5. Then the table becomes:
| S.No. | Length (in mm) | Number of leaves |
| 1. | 117.5 – 126.5 | 3 |
| 2. | 126.5 – 135.5 | 5 |
| 3. | 135.5 – 144.5 | 9 |
| 4. | 144.5 – 153.5 | 12 |
| 5. | 153.5 – 162.5 | 5 |
| 6. | 162.5 – 171.5 | 4 |
| 7. | 171.5 – 180.5 | 2 |
The above data is represented through a histogram as below:
(ii) Yes, the data given in the question can also be represented by a frequency polygon.
(iii) No, we cannot conclude that the maximum number of leaves is 153 mm long because the maximum number of leaves are lying in between the length of 144.5 – 153.5
5. The following table gives the life times of 400 neon lamps:
| Life Time (in hours) | Number of lamps |
| 300 – 400 | 14 |
| 400 – 500 | 56 |
| 500 – 600 | 60 |
| 600 – 700 | 86 |
| 700 – 800 | 74 |
| 800 – 900 | 62 |
| 900 – 1000 | 48 |
(i) Represent the given information with the help of a histogram.
(ii) How many lamps have a life time of more than 700 hours?
Answer –
(i) From the data given we plot the histogram as:
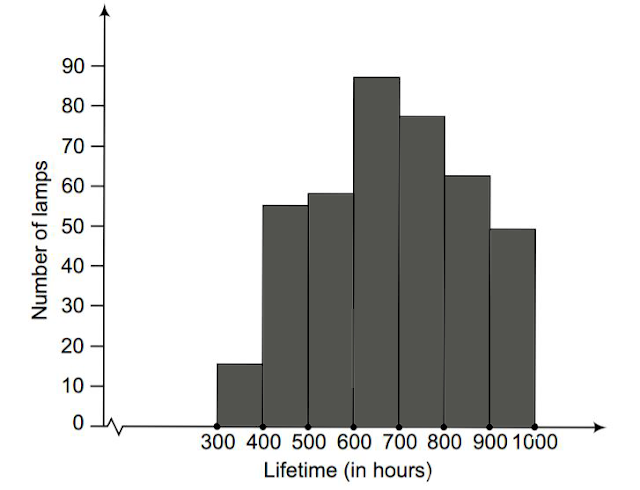
(ii) The number of lamps having a life time of more than 700 hours = 74 + 62 + 48 = 184
6. The following table gives the distribution of students of two sections according to the marks obtained by them:
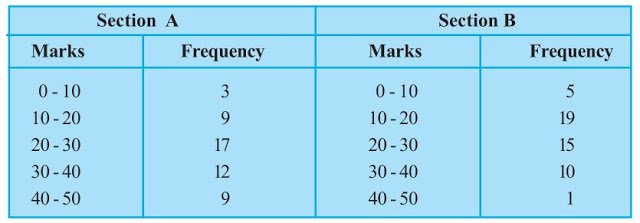
Represent the marks of the students of both the sections on the same graph by two frequency polygons. From the two polygons, compare the performance of the two sections.
Answer – Class Mark = (Upper Limit + Lower Limit)/2
Now, the data table with the inclusion of class marks is as follows:
For section A,
| Marks | Class-marks | Frequency |
| 0 – 10 | 5 | 3 |
| 10 – 20 | 15 | 9 |
| 20 – 30 | 25 | 17 |
| 30 – 40 | 35 | 12 |
| 40 – 50 | 45 | 9 |
For section B,
| Marks | Class-marks | Frequency |
| 0 – 10 | 5 | 5 |
| 10 – 20 | 15 | 19 |
| 20 – 30 | 25 | 15 |
| 30 – 40 | 35 | 10 |
| 40 – 50 | 45 | 1 |
Representing these data on a graph using two frequency polygon we get,
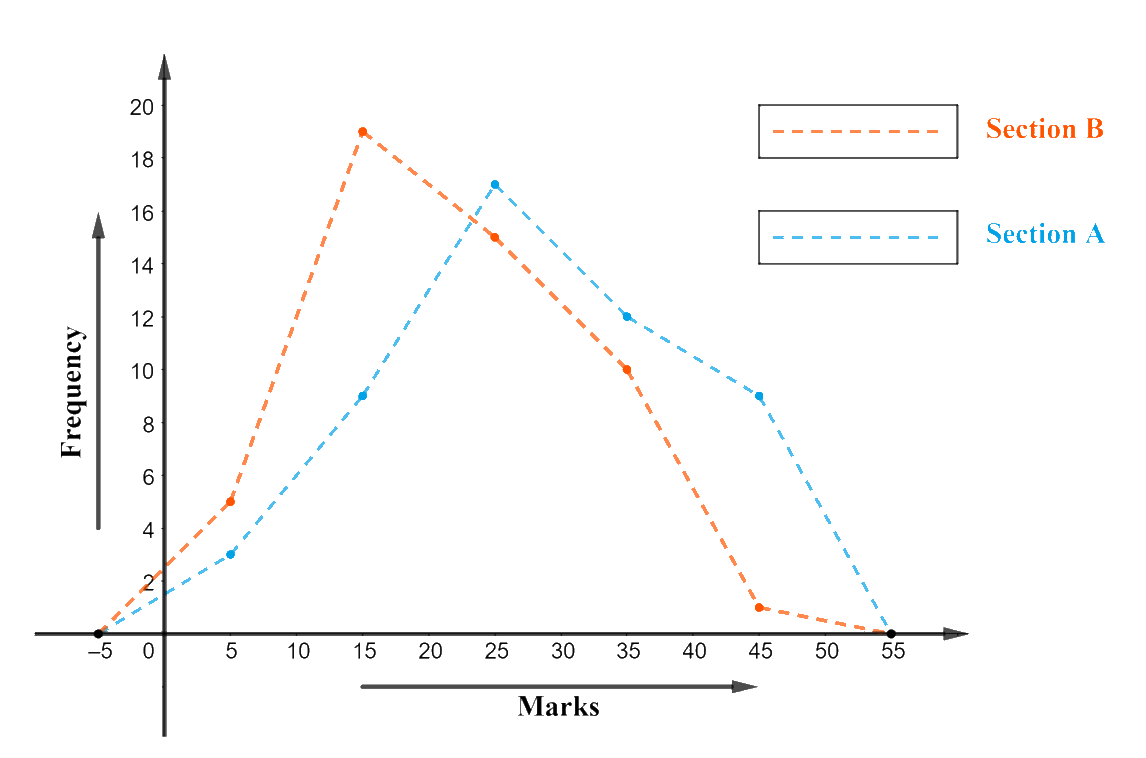
From the graph, we can conclude that the students of Section A performed better than Section B.
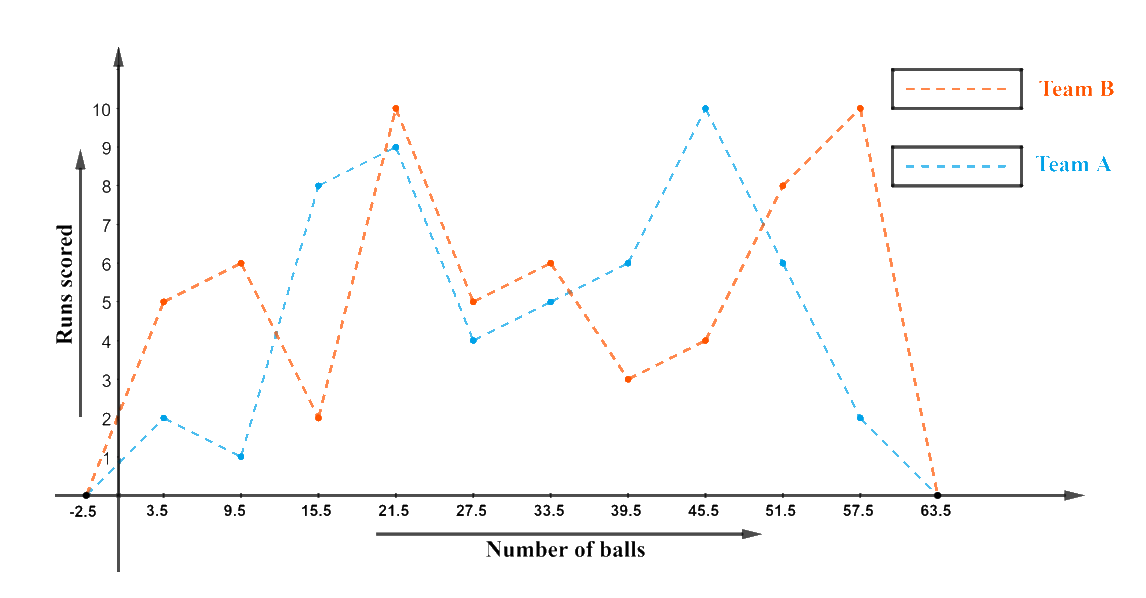
7. The runs scored by two teams A and B, on the first 60 balls in a cricket match are given below:
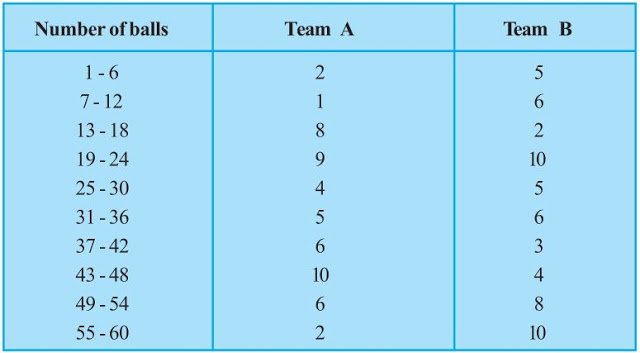
Represent the data of both teams on the same graph by frequency polygons.
[Hint: First make the class intervals continuous.]
Answer – The data given in the question is represented in discontinuous class intervals. So, we have to make it in continuous class intervals. The difference is 1, so taking half of 1, we subtract ½ = 0.5 = 0.5 from the lower limit and add 0.5 to the upper limit. Then the table becomes:
| Number of balls | Class Mark | Team A | Team B |
| 0.5 – 6.5 | 3.5 | 2 | 5 |
| 6.5 – 12.5 | 9.5 | 1 | 6 |
| 12.5 – 18.5 | 15.5 | 8 | 2 |
| 18.5 – 24.5 | 21.5 | 9 | 10 |
| 24.5 – 30.5 | 27.5 | 4 | 5 |
| 30.5 – 36.5 | 33.5 | 5 | 6 |
| 36.5 – 42.5 | 39.5 | 6 | 3 |
| 42.5 – 48.5 | 45.5 | 10 | 4 |
| 48.5 – 54.5 | 51.5 | 6 | 8 |
| 54.5 – 60.5 | 57.5 | 2 | 10 |
The data of both the teams are represented on the graph below by frequency polygons.
8. The results of a random survey of the number of children of various age groups playing in a park were as follows:
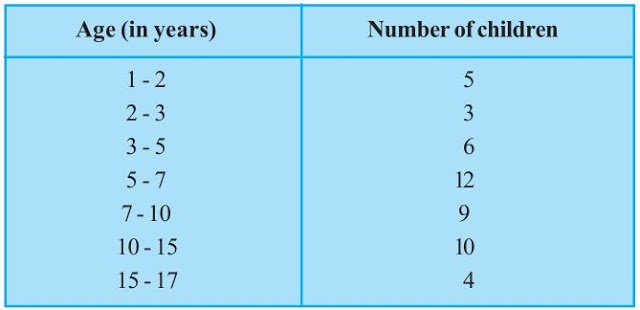
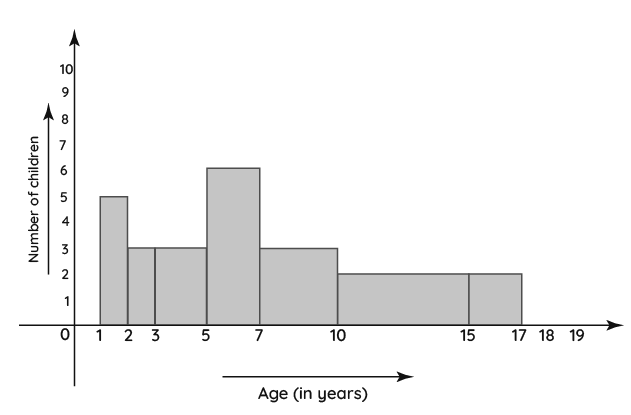
Draw a histogram to represent the data above.
Answer – The width of the class intervals in the given data is varying.
We know that,
The area of a rectangle is proportional to the frequencies in the histogram.
Thus, the proportion of the children per year can be calculated as given in the table below.
| Age (in years) |
Number of children (frequency) |
Width of class | Length of rectangle |
| 1 – 2 | 5 | 1 | (5/1) × 1 = 5 |
| 2 – 3 | 3 | 1 | (3/1) × 1 = 3 |
| 3 – 5 | 6 | 2 | (6/2) × 1 = 3 |
| 5 – 7 | 12 | 2 | (12/2) × 1 = 6 |
| 7 – 10 | 9 | 3 | (9/3) × 1 = 3 |
| 10 – 15 | 10 | 5 | (10/5) × 1 = 2 |
| 15 – 17 | 4 | 2 | (4/2) × 1 = 2 |
Let x-axis = the age of children
y-axis = proportion of children per 1-year interval
9. 100 surnames were randomly picked up from a local telephone directory and a frequency distribution of the number of letters in the English alphabet in the surnames was found as follows:
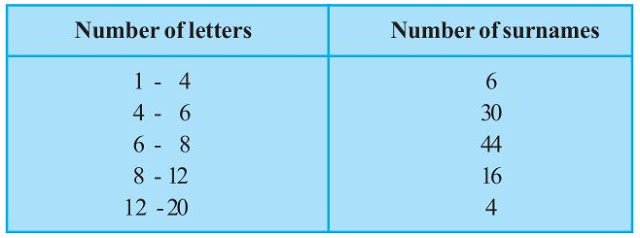
(i) Draw a histogram to depict the given information.
(ii) Write the class interval where the maximum number of surnames lie.
Answer –
It can be observed from the given data that it has class intervals of varying widths.
The proportion of the number of surnames per 2 letters (class interval of minimum class size for reference) can be made.
(i) The length of rectangles are calculated as below:
| Number of letters | Number of surnames | Width of class | Length of rectangle |
| 1 – 4 | 6 | 3 | (6/3) × 2 = 4 |
| 4 – 6 | 30 | 2 | (30/2) × 2 = 30 |
| 6 – 8 | 44 | 2 | (44/2) × 2 = 44 |
| 8 – 12 | 16 | 4 | (16/4) × 2 = 8 |
| 12 – 20 | 4 | 8 | (4/8) × 2 = 1 |
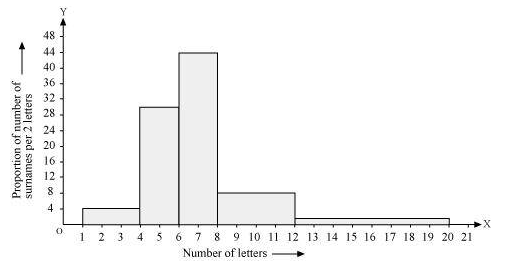
(ii) The class interval in which the maximum number of surnames lie is 6 – 8.
Leave a Reply