
NCERT Solutions Class 8 Mathematics
Chapter – 15 (Introduction to Graphs)
The NCERT Solutions in English Language for Class 8 Mathematics Chapter – 15 Introduction to Graphs Exercise 15.3 has been provided here to help the students in solving the questions from this exercise.
Chapter 15: Introduction to Graphs
Exercise – 15.3
1. Draw the graphs for the following tables of values, with suitable scales on the axes.
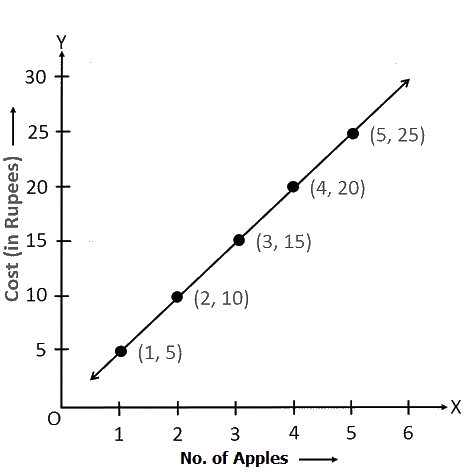
(a) Cost of apples
| Number of apples | 1 | 2 | 3 | 4 | 5 |
| Cost (in ₹) | 5 | 10 | 15 | 20 | 25 |
(b) Distance travelled by a car
| Time (in hours) | 6 a.m. | 7 a.m. | 8 a.m. | 9 a.m. |
| Distance (in km) | 40 | 80 | 120 | 160 |
(i) How much distance did the car cover during the period 7.30 a.m. to 8 a.m.?
(ii) What was the time when the car had covered a distance of 100 km since it’s start?
(c) Interest on deposits for a year.
| Deposit (in ₹) | 1000 | 2000 | 3000 | 4000 | 5000 |
| Simple Interest (in ₹) | 80 | 160 | 240 | 320 | 400 |
(i) Does the graph pass through the origin?
(ii) Use the graph to find the interest on ₹ 2500 for a year.
(iii) To get an interest of ₹ 280 per year, how much money should be deposited?
Solution –
(a) Taking a suitable scale:
For x-axis, 2 unit = 1 apple and for y-axis, 2 unit = Rs 5.
We can mark the number of apples on the x-axis and the cost of apples on the y-axis. A graph of the given data is as follows.
(b) Represent the “time” on x-axis and “distance” on y-axis.
For x-axis, 4 units = 1 hour and for y-axis, 2 units = 20 km, We can represent the time on the x-axis and the distance covered by the car on the y-axis. A graph of the given data is as follows.
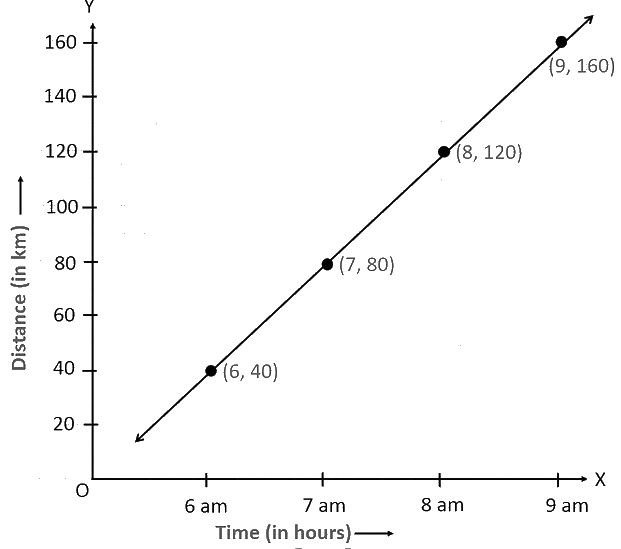
(i) The car covered 20 km distance
(ii) It was 7.30 am, when it covered 100 km distance.
(c) Represent “Deposit” on y-axis and “simple interest” on x-axis.
For x-axis, 2 unit = Rs 1000 and for y-axis, 2 unit = Rs 50
We can represent the deposit on the x-axis and the interest earned on that deposit on the y-axis. A graph of the given data is obtained as follows.
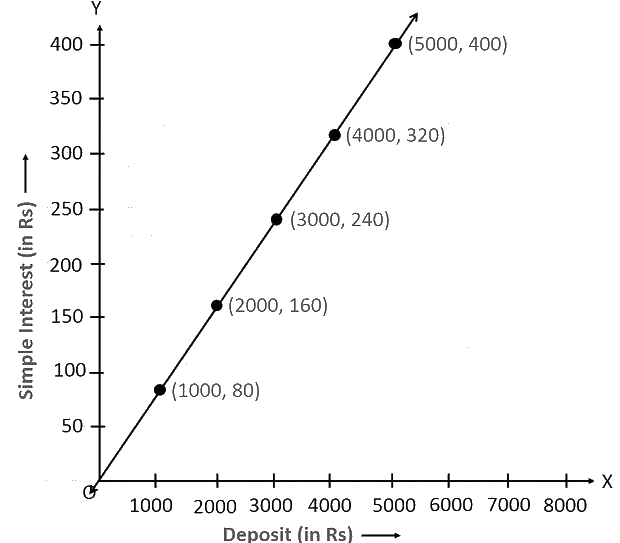
(i) Yes, the graph passes through the origin.
(ii) Interest on Rs. 2500 is Rs. 200 for a year.
(iii) Rs. 3500 should be deposited for interest of Rs. 280
2. Draw a graph for the following
(i)
| Side of square (in cm) | 2 | 3 | 3.5 | 5 | 6 |
| Perimeter (in cm) | 8 | 12 | 14 | 20 | 24 |
Is it linear graph?
(ii)
| Side of square (in cm) | 2 | 3 | 4 | 5 | 6 |
| Area (in cm2) | 4 | 9 | 16 | 25 | 36 |
Is it linear graph?
Solution –
(i) For x-axis, 2 unit = 1 cm and for y-axis, 2 unit = 5 cm
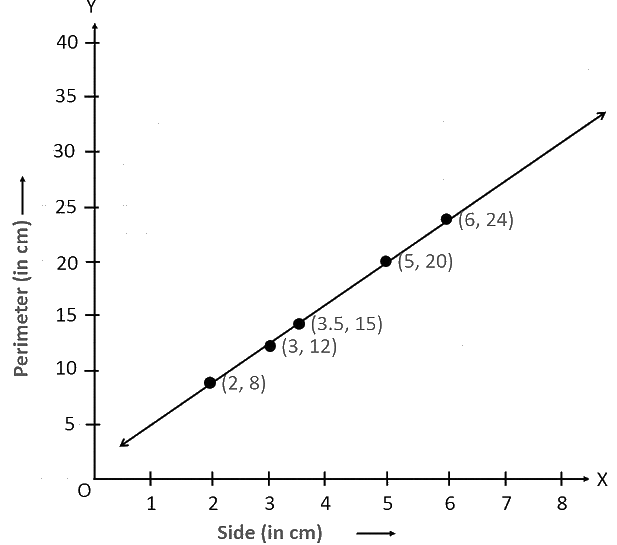
Yes, it is linear graph
(ii) For x-axis, 2unit = 1 cm and for y-axis, 2 unit = 5 cm
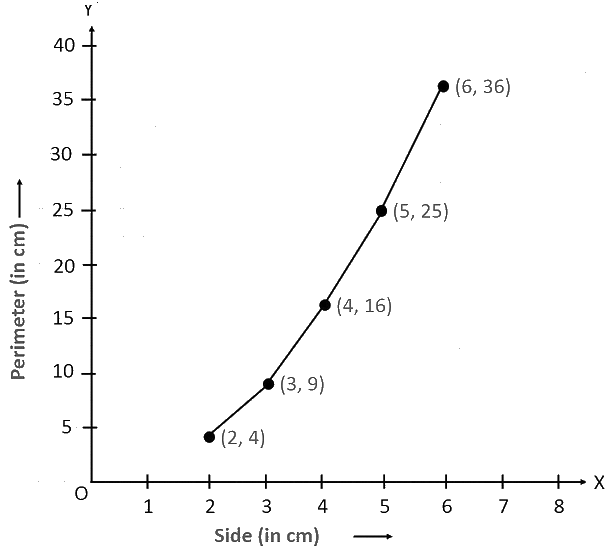
No, it is not a linear graph because the graph does not provide a straight line.
Leave a Reply