
NCERT Solutions Class 7 Mathematics
Chapter – 3 (Data Handling)
The NCERT Solutions in English Language for Class 7 Mathematics Chapter – 3 Data Handling Exercise 3.3 has been provided here to help the students in solving the questions from this exercise.
Chapter : 3 Data Handling
- NCERT Solution Class 7 Maths Exercise – 3.1
- NCERT Solution Class 7 Maths Exercise – 3.2
- NCERT Solution Class 7 Maths Exercise – 3.4
Exercise – 3.3
1. Use the bar graph (Fig 3.3) to answer the following questions.
(a) Which is the most popular pet?
(b) How many students have dog as a pet?
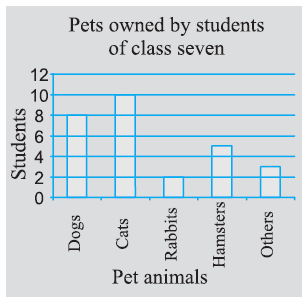
Fig 3.3
Solution –
The bar graph represents the pets owned by the students.
(a) Cats are the most popular pet among the students.
(b) 8 students have dog as a pet animal.
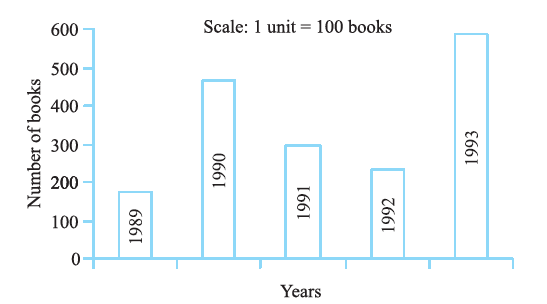
2. Read the bar graph (Fig 3.4) which shows the number of books sold by a bookstore during five consecutive years and answer the following questions:
(i) About how many books were sold in 1989? 1990? 1992?
(ii) In which year were about 475 books sold? About 225 books sold?
(iii) In which years were fewer than 250 books sold?
(iv) Can you explain how you would estimate the number of books sold in 1989?
Solution –
(i) By observing bar graph,
175 books were sold in the year 1989.
475 books were sold in the year 1990.
225 books were sold in the year 1992.
(ii) By observing bar graph,
475 books were sold in the year 1990.
225 books were sold in the year 1992.
(iii) By observing bar graph,
In the years 1989 and 1992, the number of books sold were less than 250.
(iv) By observing the bar graph, we can conclude that,
The number of books sold in the year 1989 is about 1 and ¾th part of 1 cm.
Scale is taken as 1 cm = 100 books
= 100 + (¾ × 100)
= 100 + (3 × 25)
= 100 + 75
= 175
3. Number of children in six different classes are given below. Represent the data on a bar graph.
| Class | Fifth | Sixth | Seventh | Eighth | Ninth | Tenth |
| Number of Children | 135 | 120 | 95 | 100 | 90 | 80 |
(a) How would you choose a scale?
(b) Answer the following questions:
(i) Which class has the maximum number of children? And the minimum?
(ii) Find the ratio of students of class sixth to the students of class eight.
Solution –
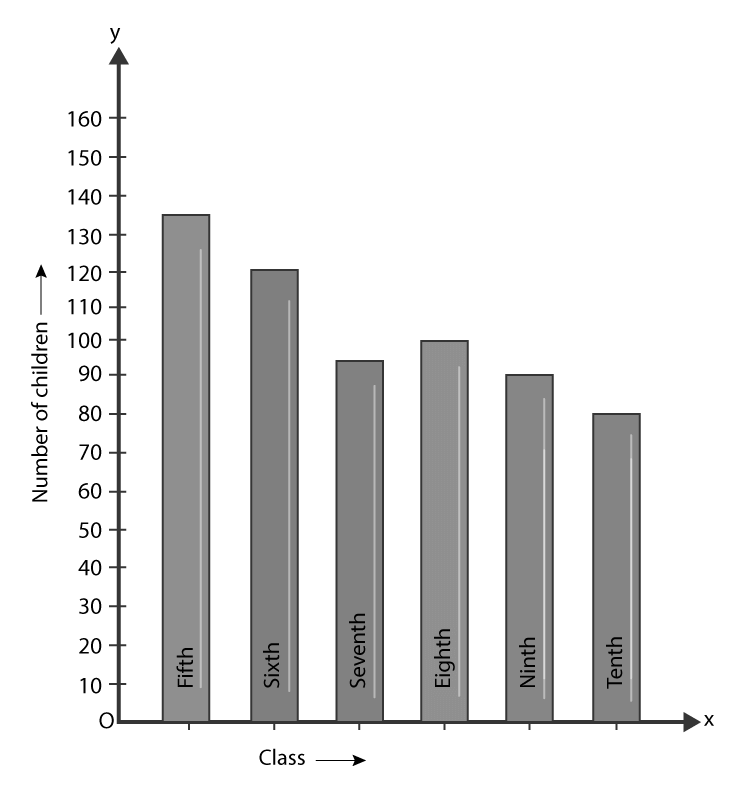
(a) Scale is 1 cm = 10 students.
(b)
(i) Class 5th has the maximum number of children i.e. 135 and class 7th has the minimum number of children i.e. 95.
(ii) The total number of students in class 6th is 120 and the total number of students in class 8th is 100
Then,
Ratio between the number of students of class 6th and 8th,
= =
= 6 : 5
4. The performance of a student in 1st Term and 2nd Term is given. Draw a double bar graph choosing appropriate scale and answer the following:
| Subject | English | Hindi | Maths | Science | S. Science |
| 1st Term (M.M. 100) | 67 | 72 | 88 | 81 | 73 |
| 2nd Term (M.M. 100) | 70 | 65 | 95 | 85 | 75 |
(i) In which subject, has the child improved his performance the most?
(ii) In which subject is the improvement the least?
(iii) Has the performance gone down in any subject?
Solution –
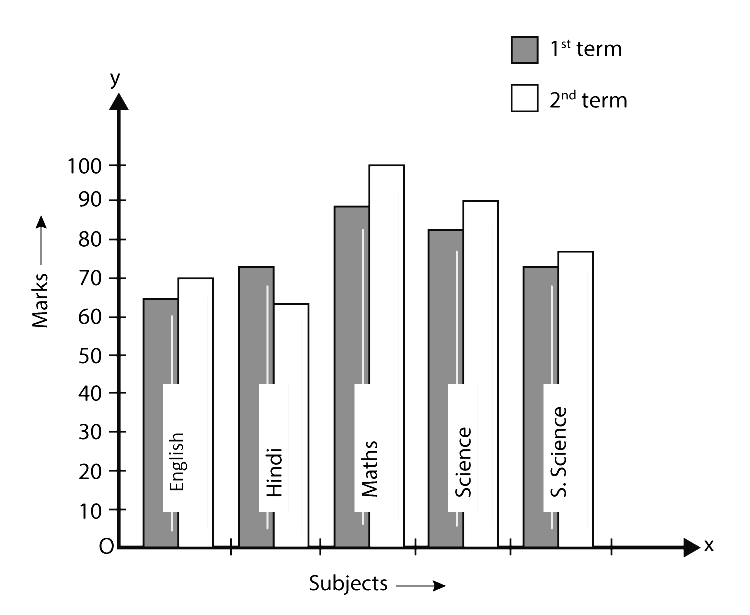 (i) In Math, the performance of the students improved the most.
(ii) In social science, the performance of the students improved the least.
(iii) Yes, in Hindi the performance of the students has gone down.
5. Consider this data collected from a survey of a colony.
| Favourite Sport | Cricket | Basket Ball | swimming | Hockey | Athletics |
| Watching | 1240 | 470 | 510 | 430 | 250 |
| Participating | 620 | 320 | 320 | 250 | 105 |
(i) Draw a double bar graph choosing an appropriate scale. What do you infer from the bar graph?
(ii) Which sport is most popular?
(iii) Which is more preferred, watching or participating in sports?
Solution –
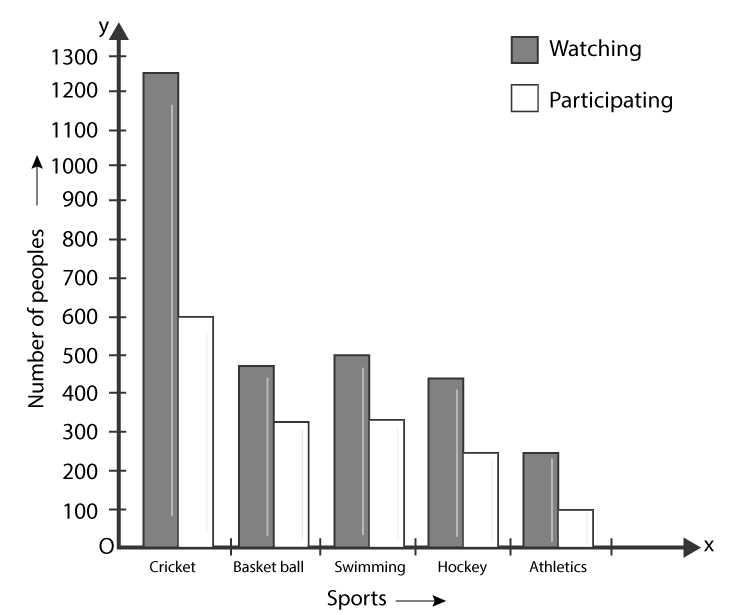
(i) The above bar graph depicts the number of people who are watching and who are participating in sports.
(ii) Cricket is the most popular sport.
(iii) Watching the sports is more preferred by the people.
6. Take the data giving the minimum and the maximum temperature of various cities given in the beginning of this Chapter (Table 3.1). Plot a double bar graph using the data and answer the following:
(i) Which city has the largest difference in the minimum and maximum temperature on the given date?
(ii) Which is the hottest city and which is the coldest city?
(iii) Name two cities where maximum temperature of one was less than the minimum temperature of the other.
(iv) Name the city which has the least difference between its minimum and the maximum temperature.
Solution –
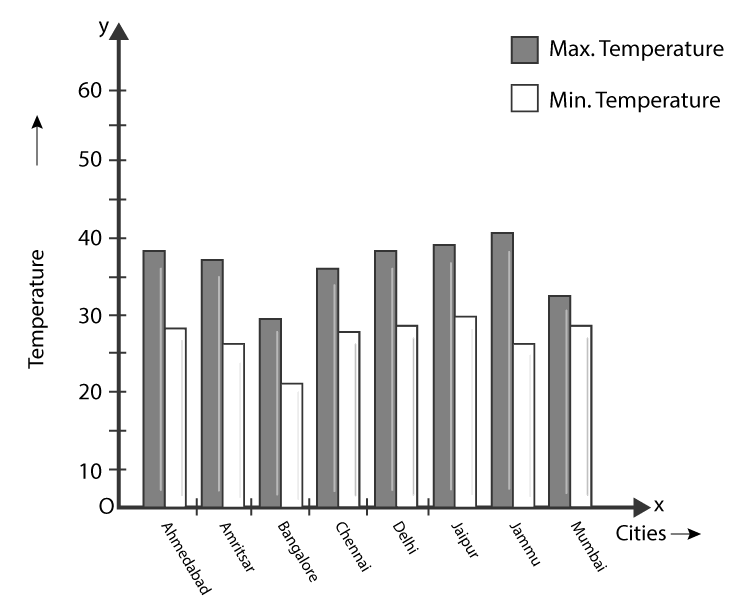 (i) Jammu has the largest difference between the maximum and minimum temperature i.e. 41°C – 26°C = 15°C on 20.6.2006.
(ii) Hottest city is Jammu with 41°C temperature and coldest city is Bengaluru with 21°C temperature.
(iii) Bengaluru having its maximum temperature 28°C is less than the minimum temperature 29°C in Ahmedabad.
Bengaluru having its maximum temperature 28°C is less than the maximum temperature 29°C in Jaipur.
(iv) Mumbai has the least difference between its minimum and maximum temperatures i.e. 32°C – 27°C = 5°C
Leave a Reply