

Q. 81-85 : The given Line graph Data Interpretation Chart shows the sales of shoes (in thousands) from six stores in six different cities Kolkata, Patna, Dhanbad, Ranchi, Asansol and Gaya during three consecutive years 2020, 2021 and 2022 :

81. What is the ratio of the total sales of Patna store for three years to the total sales of Asansol store for three years?
(A) 190/325
(B) 380/640
(C) 30/61
(D) 172/189
Click To Show Answer/Hide
82. Total number of shoes sales on Gaya store and Patna store together for three years is approximately what percent of the total sales of Dhanbad store and Ranchi store together for three years ?
(A) 72.23%
(B) 76.75%
(C) 80.51%
(b) 86.81%
Click To Show Answer/Hide
83. What percent of the average sales of shoes on Kolkata store, Patna store and Dhanbad store in 2021 is the average sales of shoes on Ranchi store, Asansol store and Gaya store in 2022 ?
(A) 86.12%
(B) 77.5%
(C) 129.03%
(D) 93.94%
Click To Show Answer/Hide
84. What is the ratio of average sales of shoes of all the stores for the year 2020 to average sales of shoes of all the stores for the year 20217
(A) 45/59
(B) 24/43
(C) 121/253
(D) 122/216
Click To Show Answer/Hide
85. What is the total number of shoes sales of Kolkata store, Patna store and Ranchi store together for three years?
(A) 1140
(B) 1250
(C) 1650
(D) 1820
Click To Show Answer/Hide
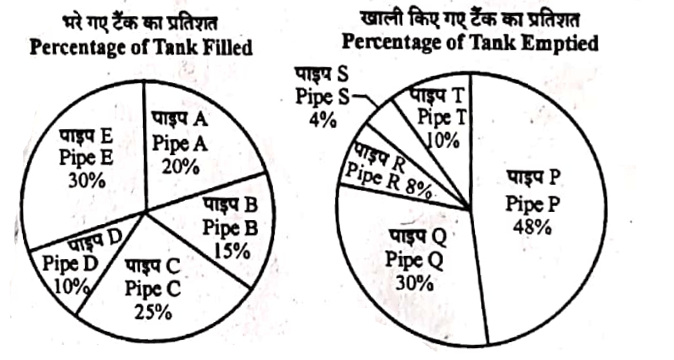
Q. 86-90 : There are five inlet pipes (A, B, C, D and E) and five outlet pipes (P, Q, R, S and T ) connected to a tank. The first pie-chart represents the percentage of the tank filled by each inlet pipe when all the inlet pipes are opened together and the second pie-chart represents the percentage of the tank emptied by each outlet pipe when all the outlet pipes are opened together.
Total capacity of the tank = 1000 litres
Time taken to fill the tank when all the inlet pipes are opened together = 2 minutes
Time taken to empty the tank when all the outlet pipes are opened together = 1.6 minutes
86. Find the approximate time taken to fill the tank if pipes A, B, D, R and S are opened together.
(A) 18 minutes
(B) 15 minutes
(C) 9. 2 minutes
(D) 6.67 minutes
Click To Show Answer/Hide
87. Find the ratio of the sum of the time taken by pipe C alone and time taken by pipe D alone to fill the tank to the sum of the time taken by pipe R alone and time taken by T alone to empty the tank.
(A) 8:15
(B) 7:9
(C) 16:17
(D) 9:13
Click To Show Answer/Hide
88. The time taken by pipes B and C together to fill the tank is approximately how many minutes more than the time taken by pipes A, D and E together?
(A) 3.5 minutes
(B) 1.67 minutes
(C) 2.89 minutes
(D) 4.2 minutes
Click To Show Answer/Hide
89. What will be the ratio of the time taken by pipes P and R together to empty the tank to the time taken by pipes Q, S and T together to empty the tank ?
(A) 5 : 11
(B) 11 : 8
(C) 11 : 14
(D) 14 : 11
Click To Show Answer/Hide
90. If all the inlet pipes and the outlet pipes are opened together then find the time taken to empty the full tank.
(A) 8 minutes
(B) 5 minutes
(C) 12 minutes
(D) 20 minutes
Click To Show Answer/Hide
Q91-95 : Study the table charts carefully and answer the questions given below:
Table 1 shows the Production, Export and Import of crude oil of 5 countries in 2020 while Table 2 shows the percentage increase in Production, Export and Import of crude oil from 2020 to 2022 Study the tables and answer the questions: Note : Consumption = Production + Import Export
Table 1 :
| Country | Production | Export | Import |
| Afghanistan | 2100 | 600 | 400 |
| Bangladesh | 1400 | 400 | 300 |
| Bhutan | 2000 | 800 | 400 |
| India | 2200 | 600 | 500 |
| Maldives | 700 | 500 | 1300 |
Table 2 :
| Country | Production | Export | Import |
| Afghanistan | 20% | 15% | 18% |
| Bangladesh | 25% | 24% | 22% |
| Bhutan | 25% | 25% | 20% |
| India | 22% | 20% | 15% |
| Maldives | 24% | 25% | 22% |
91. What is the average consumption of crude oil in each of the five countries in 2020 ?
(A) 1200
(B) 1680
(C) 2200
(D) 2400
Click To Show Answer/Hide
92. What is the average consumption of crude oil in each of the five countries in 2022 ?
(A) 512
(B) 1024
(C) 2054
(D) 1568
Click To Show Answer/Hide
93. What is the export to import ratio of the 5 countries together in 2020 ?
(A) 213/60
(B) 175/13
(C) 1
(D) 13/175
Click To Show Answer/Hide
94. The percentage increase in the crude oil consumption from 2020 to 2022, is highest for which among the following countries ?
(A) Afghanistan
(B) Bangladesh
(C) Bhutan
(D) Maldives
Click To Show Answer/Hide
95. In 2022, which country’s import to consumption ratio was highest among the following countries?
(A) Afghanistan
(B) Bangladesh
(C) Bhutan
(D) Maldives
Click To Show Answer/Hide
Q. 96 – 100 : Study the following table chart carefully and answer the questions given below: Akshay has 5000 litres of pure milk. He sells 40% of the total milk to six different persons (A, B, C, D, E, F) and the remaining 60% of total milk he utilizes in his own shop. Each person, A, B, C, D, E and F mixes water in pure milk. The table given below shows the sales of milk to six different persons by Akshay as a percentage of total sales and it also shows the concentration of water after adding water in pure milk by each of the six persons.
| Person | Sales of Milk | The concentration of water (After adding water in pure milk) |
| A | 20% | 20% |
| B | 10% | 10% |
| C | 10% | 15% |
| D | 10% | 18% |
| E | 30% | 25% |
| F | 20% | 12% |
96. What is the difference between the total quantity of water added by Person A and that of Person C ? (approximately )
(A) 56 litres
(B) 65 litres
(C) 73 litres
(D) 75 litres
Click To Show Answer/Hide
97. What is the respective ratio of the total quantity of water added by Person C and the total quantity of water added by Person E?
(A) 8 : 34
(B) 81 : 287
(C) 83 : 285
(D) 3 : 17
Click To Show Answer/Hide
98. Who among the following added least quantity (in litres) of water in pure milk ?
(A) B
(B) C
(C) D
(D) F
Click To Show Answer/Hide
99. Suppose, A, B and C mix their solutions in one vessel then what would be the concentration of milk in the new solution? (approximately)
(A) 75.2%
(B) 78.21%
(D) 89.65%
(C) 83.55%
Click To Show Answer/Hide
100. How many total litres of water was added by all the persons together ? (approximately )
(A) 469
(B) 450
(C) 456
(D) 478
Click To Show Answer/Hide


Leave a Reply