Q. Nos. 62 to 66 : Study the following line graph which gives the number of employees who joined the company and left the company 1 in the beginning of each year during six years, from 2001 to 2006. (There is no employee I joined the company or left the company during the year 2000.)

62. The number of employees working in the company during 2003 was :
(A) 4650
(B) 5000
(C) 5300
(D) 5500
Click To Show Answer/Hide
63. The ratio of the least number of employees who joined the company to the maximum number of employees who left company in any of the years during the given period is
(A) 14/13
(B) 9/17
(C) 12/17
(D) 9/13
Click To Show Answer/Hide
64. For which year, the percentage rise/fall in the number of employees who left the company compared to the previous year is maximum ?
(A) 2002
(B) 2001
(C) 2003
(D) 2004
Click To Show Answer/Hide
65. The strength of employees increased / decreased from 2002 to 2003 by] approximately what percent ?
(A) 2%
(B) 1%
(C) 3%
(D) 4%
Click To Show Answer/Hide
66. The number of employees working in the company in 2003 was approximately what percent of the number of employees working in the company in 2006 ?
(A) 96.15%
(B) 93.75%
(C) 98%
(D) 97.35%
Click To Show Answer/Hide
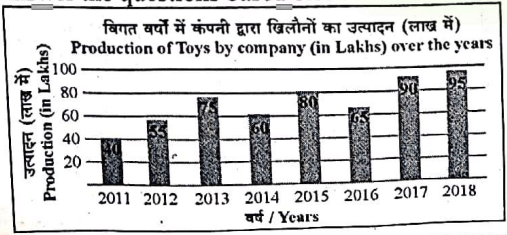
Q. Nos. 67 to 71 : Study the bar graph and answer the questions based on it.

67. In which year the percentage increase in production was maximum as compared to the previous year?
(A) 2013
(B) 2012
(C) 2015
(D) 2017
Click To Show Answer/Hide
68. In how many of the given years was the production of toys more than the average production of the given years?
(A) 2
(B) 1
(C) 3
(D) 4
Click To Show Answer/Hide
69. What was the approximate percentage decline in the production of toys from 2013 to 2014?
(A) 15%
(B) 10%
(C) 20%
(D) 25%
Click To Show Answer/Hide
70. The average production of 2015 and 2016 was exactly equal to the average production of which of the following pair of years?
(A) 2014 and 2015
(B) 2016 and 2017
(C) 2012 and 2017
(D) 2014 and 2016
Click To Show Answer/Hide
71. What was the approximate percentage increase in production of toys in 2018 compared to that in 2011 ?
(A) 137.5%
(B) 183.33%
(C) 128.35%
(D) 111.11%
Click To Show Answer/Hide
72. The pietra dura or coloured stone inlay work on marble became very popular in the days of _______.
(A) Akbar
(B) Shahjahan
(C) Aurangzeb
(D) None of these
Click To Show Answer/Hide
73. In which of the following age copper was first used ?
(A) Mesolithic Age
(B) Chalcolithic Age
(C) Paleolithic Age
(D) Neolithic Age
Click To Show Answer/Hide
74. The first Buddhist Council was held at whích among the following places ?
(A) Kashmir
(B) Gaya
(C) Rajgir
(D) Pataliputra
Click To Show Answer/Hide
75. Who among the following is the person whose name was also ‘Devanampiya Piyadassi’ ?
(A) Mauryan Emperor Chandragupta
(B) Mauryan Emperor Ashoka
(C) Gautam Buddha
(D) Lord Mahavirrr
Click To Show Answer/Hide
76. When the East India Company was established, India was ruled by whom among the following ?
(A) A Gupta Emperor
(B) A Maurya Emperor
(C) A Mughal Emperor
(D) A Sunga Emperor
Click To Show Answer/Hide
77. The Bhoodan-Gramdan movement had been started by whom – among the following ?
(A) Vinoba Bhave
(B) M. K. Gandhi
(C) Jayaprakash Narayana
(D) Acharya Kripalani
Click To Show Answer/Hide
78. During the Dandi Salt March, which among the following social activist had persuaded Gandhiji not to restrict the protests to men alone ?
(A) Pandita Ramabai
(B) Kamaladevi Chattopadhyay
(C) Madam Camar
(D) None of these
Click To Show Answer/Hide
79. The first clear expression of nationalism came with which among the following revolutions?
(A) The Industrial Revolution
(B) The American Revolution
(C) The Russian Revolution
(D) The French Revolution
Click To Show Answer/Hide
80. Which among the following Acts of the Government led to the creation of the Sind Province from Bombay ?
(A) Indian Independence Act, 1947
(B) Wavell Plan
(C) Cripps Mission
(D) Government of India Act, 1935
Click To Show Answer/Hide


Leave a Reply